
Based on a true story! This article grew out of an experience debugging a very sneaky infinite loop on the Arts Theatre West End website. You know, the theater where a little show called Six is playing? The site is powered by our open-source Node.js CMS, ApostropheCMS. And needless to say, when you’re selling tickets, reliability is everything.
The worst has happened. Your Node.js application is stuck in a good old-fashioned infinite loop. Express is listening for connections, but never responds. top shows 100% CPU.
You chose Node.js for its single-threaded performance and most days you’re very happy about that. This is not one of those days. Since there is just one thread of execution, all requests reaching this particular process are stuck.
Sure, you’re running one process per core and even on multiple servers. But if a common operation is the cause, all of the processes encounter it before long, and the application is effectively down. You are not having a good day.
No problem, you say as you sync your database down to a dev environment and try to reproduce the issue. Here in dev, you can console.log your way through it if you have to, following a “divide and conquer” strategy.
Except… you can’t. Something is happening in production that you have never thought of, and you don’t know what it is. So you can’t reproduce it. You need to debug your node.js application in production. 🙀
You could redeploy your app with lots of additional logging, and that’s not a bad thing. But what if you could find out exactly what code is running right now? Then you could see the problem immediately and save a great deal of downtime.
There’s a way: the Node.js command line debugger.
First, ssh into the server or open a shell in your container, if that’s how you roll. Then run top and find your runaway process. It’ll sort right to the top of the list:

Process 4702, using close to 100% of CPU.
Gee, think maybe that’s the one?
Now, let’s tell the process to listen for debugging requests.
Yes, we’re using a command called kill. No, we’re not killing the process. We’re sending it a different signal.
kill -SIGUSR1 4702
Once you do this, the process is open to a node.js debugger connection. In fact, it will print a special URL to its console log, and you can open that URL in Chrome devtools to debug the process! But, maybe you don’t want to drill a hole through a firewall and a container debug configuration just to make that connection. Yeah, me neither.
So let’s debug at the command line instead:
node inspect -p 4702
You’ll see this prompt:
debug>
Holy smokes, you’re in the debugger! Let’s print a stack trace to see where you are in the code:
backtrace
But you just get back:
null
Hmm, that’s not very useful. Let’s type help and see if there’s anything about how to pause the process… nope!
Fortunately, I was able to find the command eventually. Sure enough, you just type:
pause
And you get back:
break in file:///somewhere/something.js:555
>555         for (prop in inputObject) {
510             if (hasOwnProp(inputObject, prop)) {
511                 normalizedProp = normalizeUnits(prop);
Yes! We have our first hint. The app was executing line 555 in file something.js.
That might be enough to see the bug right away. But usually we need more information than that. You can type backtrace to get a complete stack trace:
#0 someFunctionName file:///somewhere/somefile.js:444:22
#1 someFunctionName file:///somewhere/somefile.js:555:33
#2 someFunctionName file:///somewhere/somefile.js:666:44
… And so on.
By now you often have enough information to solve the problem. But if not, you can set breakpoints and continue execution to see if they are indeed hit over and over:
setBreakpoint('file:///somewhere/somefile.js', 444)
cont
Sure enough, you come right back to that line of code when cont continues execution. Hit cont a few times and it becomes clear you’re looping there. You can set breakpoints on other lines to figure out if it’s stuck in this inner loop here, or that outer one there, and so on.
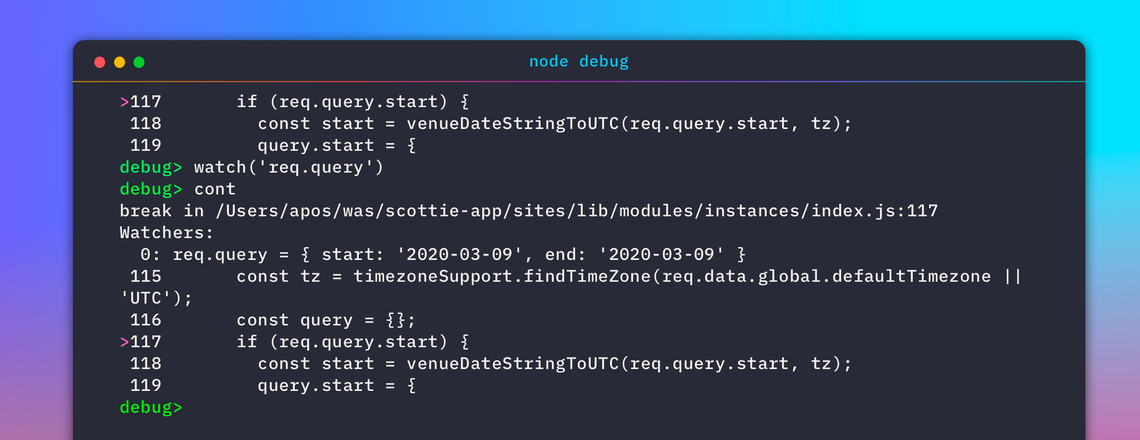
This is helpful, but you still don’t know why you’re stuck in the loop. So let’s watch a variable to find out its value the next time you reach a breakpoint:
watch('counter')
cont
And when you reach the breakpoint again, you see:
break in file:///somewhere/something.js:444
Watchers:
0: counter = NaN
>444               counter++;
Gotcha! The counter variable is NaN (“not a number”), so it can’t be incremented and will never reach the end condition for a for loop or while loop.
Now you have the debugging tools and enough information to go back to your dev environment, fix the bug, test a fix (forcing the NaN case as a test if you have to!) and ship it to production.
To close this debugging session, just press control-D to exit.
The day is saved. You love Node.js again. No more 🐛. 🙏